Stanford 2D-3D-Semantics Dataset (2D-3D-S)
RGB image
Semantics in 2D
Depth
3D Mesh
Semantics in 3D
Surface Normals
 Use your mouse on the 360° images to look around.
Select from the images below to visualize them in the 360° viewer.
Select from the areas below to visualize them in 3D

Area 1

Area 2

Area 3

Area 4

Area 5

Area 6
(these point clouds are also part of the Stanford 3D Large-Scale Indoor Spaces Dataset)
> Download
- Full 2D-3D-S Dataset To download the full 2D-3D-S dataset click here.
- S3DIS Dataset: To download only the Stanford Large-Scale 3D Indoor Spaces Dataset (S3DIS) used in this paper, which contains only the 3D point clouds with ground truth annotations, click here. These 3D point clouds are included in the 2D-3D-S dataset.
Citation
- If you use this dataset please cite the 2D-3D-S paper (bibtext).
- If you use the S3DIS portion only, you can cite the 3D Semantic Parsing of Large-Scale Indoor Spaces, CVPR2016 paper (bibtex).
> Overview
The 2D-3D-S dataset provides a variety of mutually registered modalities from 2D, 2.5D and 3D domains, with instance-level semantic and geometric annotations. It covers over 6,000 m2 and contains over 70,000 RGB images, along with the corresponding depths, surface normals, semantic annotations, global XYZ images (all in forms of both regular and 360° equirectangular images) as well as camera information. It also includes registered raw and semantically annotated 3D meshes and point clouds. In addition, the dataset contains the raw RGB and Depth imagery along with the corresponding camera information per scan location. The dataset enables development of joint and cross-modal learning models and potentially unsupervised approaches utilizing the regularities present in large-scale indoor spaces.
In more detail, the dataset is collected in 6 large-scale indoor areas that originate from 3 different buildings of mainly educational and office use. For each area, all modalities are registered in the same reference system, yielding pixel to pixel correspondences among them. In a nutshell, the presented dataset contains a total of 70,496 regular RGB and 1,413 equirectangular RGB images, along with their corresponding depths, surface normals, semantic annotations, global XYZ OpenEXR format and camera metadata. It also contains the raw sensor data, which comprises of 18 HDR RGB and Depth images (6 looking forward, 6 towards the top, 6 towards the bottom) along with the corresponding camera metadata per each of the 1,413 scan locations, yielding a total of 25,434 RGBD raw images. In addition, we provide whole building 3D reconstructions as textured meshes, as well as the corresponding 3D semantic meshes. We also include the colored 3D point cloud data of these areas with the total number of 695,878,620 points, that has been previously presented in the Stanford large-scale 3D Indoor Spaces Dataset (S3DIS).
> Collection and Processing
We collected the data using the Matterport Camera, which combines 3 structured-light sensors at different pitches to capture 18 RGB and depth images during a 360° rotation at each scan location. Each 360° sweep is performed in increments of 60°, providing 6 triplets of RGB-D data per location. The output is the reconstructed 3D textured meshes of the scanned area, the raw RGB-D images, and camera metadata. We used this data as a basis to generate additional RGB-D data and make point clouds by sampling the meshes. We semantically annotated the data directly on the 3D point cloud, rather than images, and then projected the per point labels on the 3D mesh and the image domains.
3D modalities
The dataset contains colored point clouds and textured meshes for each scanned area. 3D semantic annotations for objects and scenes are offered for both modalities, with point-level and face-level labels correspondingly. The annotations were initially performed on the point cloud and then projected onto the closest surface on the 3D mesh model. Faces in the 3D mesh that account for no projected points belong to non-annotated parts of the dataset and are labeled with a default null value. We also provide the tightest axis-aligned boudning box of each object instance and further voxelize it into a 6x6x6 grid with binary occupancy and point index correspondence.
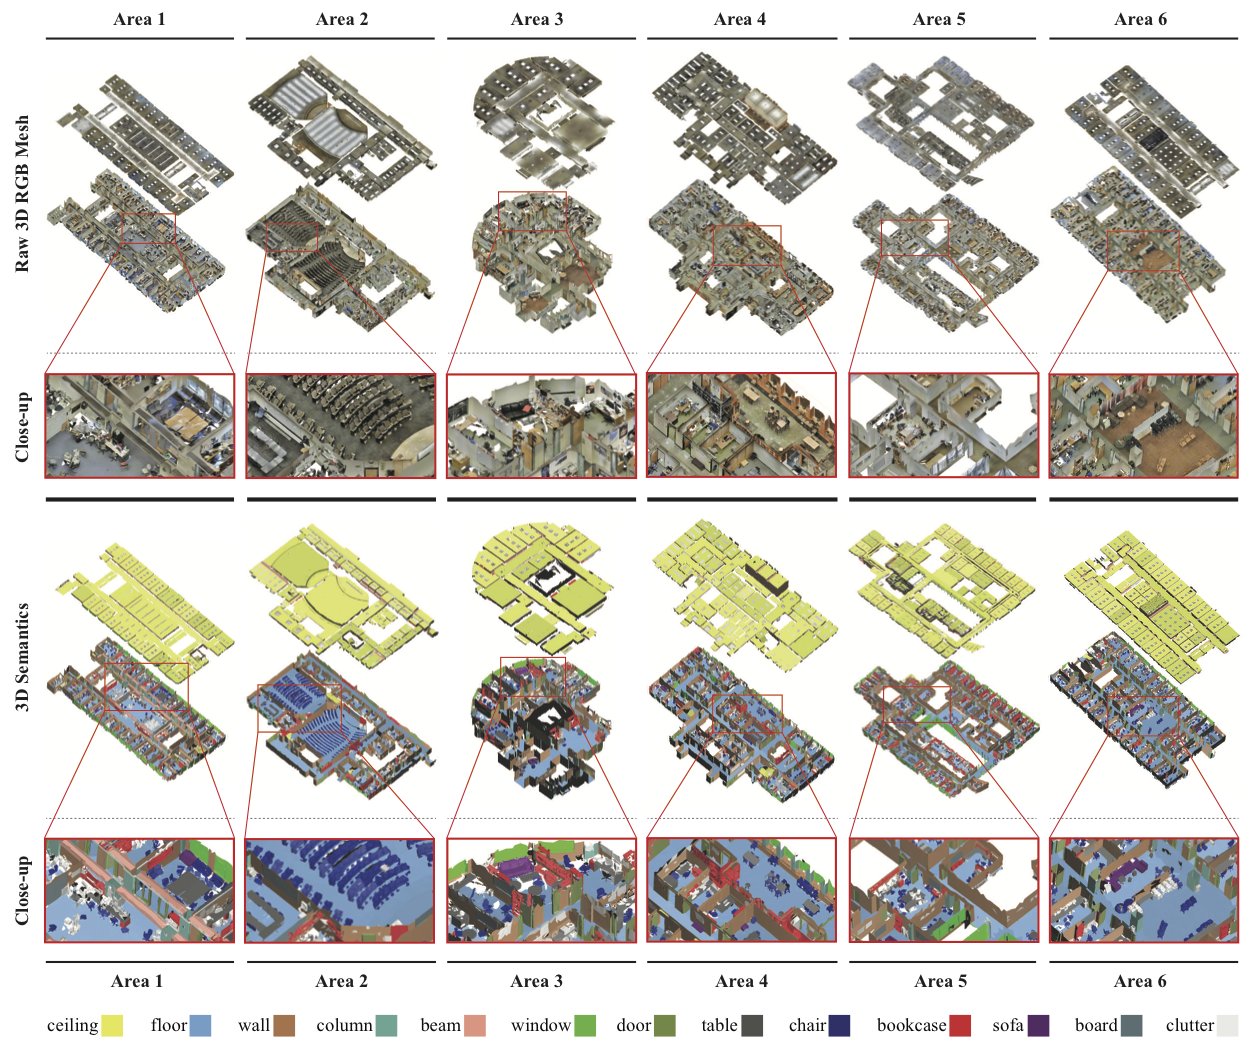
Fig 1. 3D Modalities. The dataset includes both the textured and semantic 3D mesh models of all areas as well as their point clouds.
2D modalities:
In addition to the raw RGB and depth data, the dataset contains densely sampled RGB images per scan location. These images were sampled from equirectangular images that were generated per scan location and modality using the raw data captured by the scanner. All images in the dataset are stored in full high-definition at 1080x1080 resolution. For more details on the random sampling of RGB images read section 4.2 in the paper. We provide the camera metadata for each generated image.
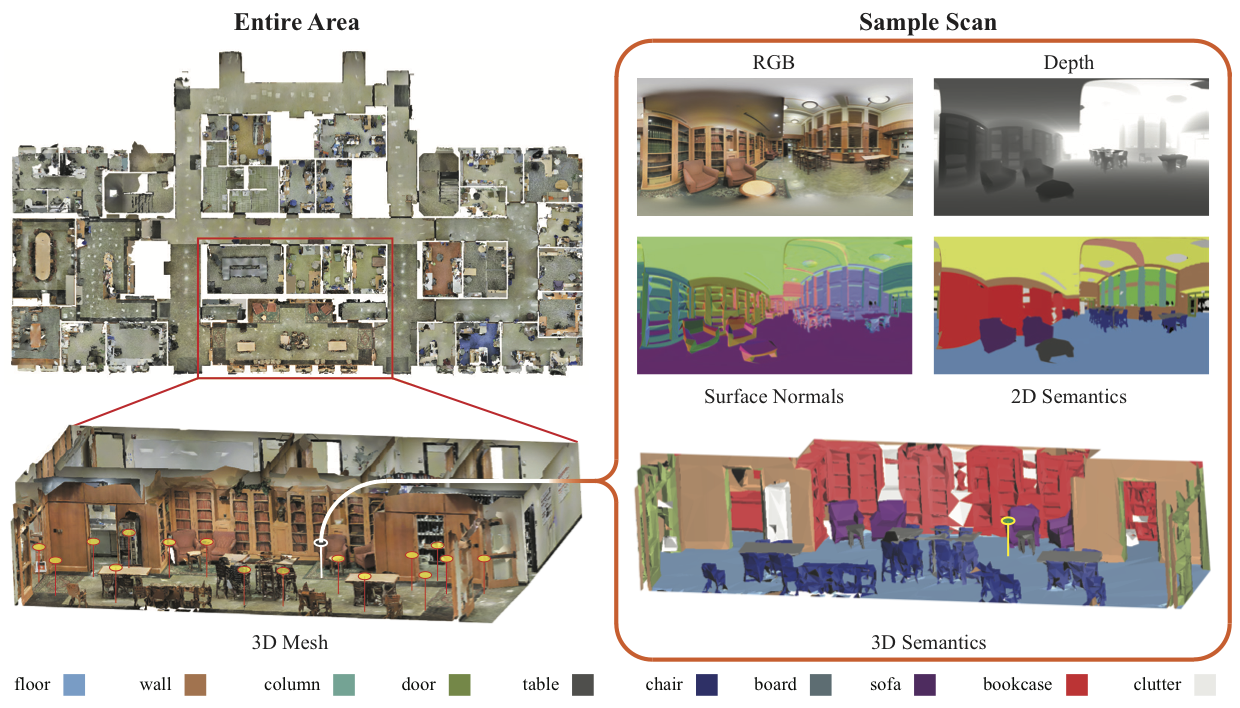
Fig 2. Data Processing. The RGB output of the scanner is registered on the 3D modalities (each yellow marker represents one scan). We then process the RGB and 3D data to make depth, surface normals, and 2D semantic (projected from 3D semantics) images for each scan. The processed equirectangular images are sampled to make new regular images.
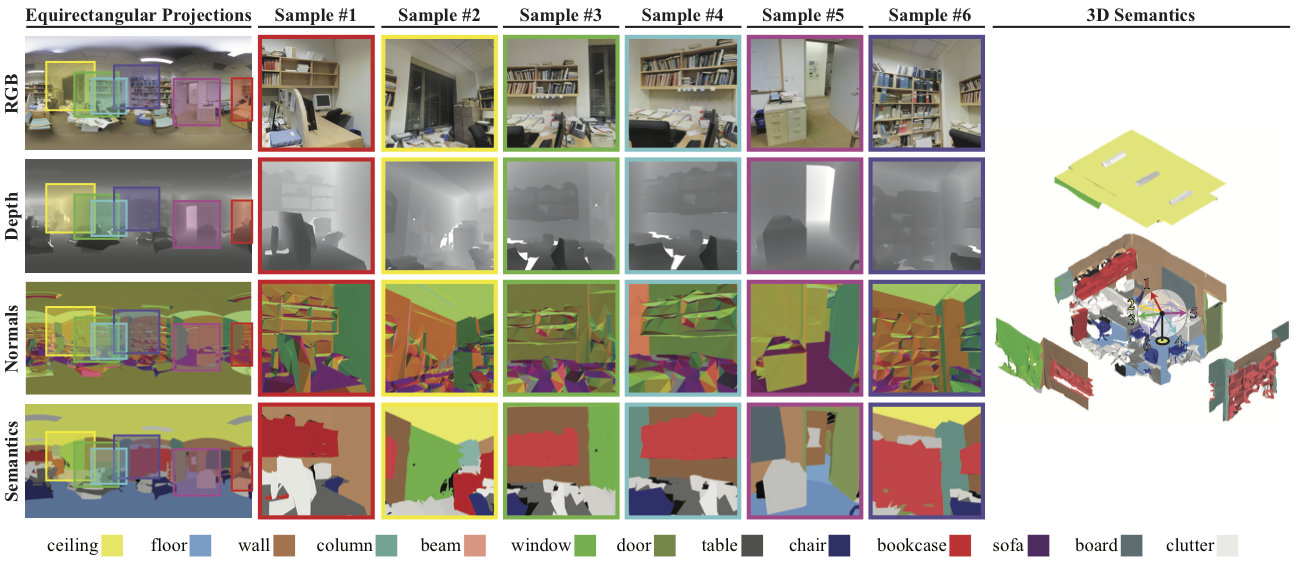
Fig 3. Sampling images from the equirectangular projection. We use the equirectangular projections to sample 72 images per scan location, all with consistent depth, surface normal, and semantic information.
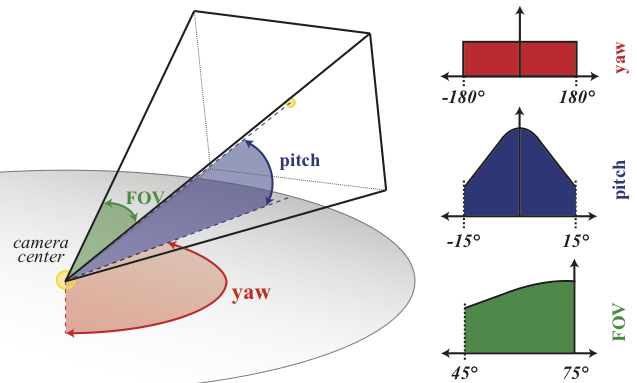
Fig 4. Sampling distributions. We sample camera parameters from the above distributions of yaw, pitch and Field of View (FOV).
We also provide the corresponding dense sampled depth images that were computed on the 3D mesh instead of directly from the scanner as with the raw Depth images, as well as surface normal images. 2D semantic annotations are computed for each image by projecting the 3D mesh labels on the image plane. Due to certain geometric artifacts present at the mesh model mainly because of the level of detail in the reconstruction, the 2D annotations occasionally present small local misalignment to the underlying pixels, especially for points that have a short distance to the camera. This issue can be easily addressed by fusing image content with the projected annotations using graphical models. The dataset also includes 3D coordinate encoded images where each pixel encodes the X, Y, Z location of the point in the world coordinate system. Such images can be used for conveniently relating the content of RGB images, e.g. forming dense correspondences. Last, an equirectangular projection is also provided per scan location and modality. For image statistics look at Table 2.
> Sample Data
The figure below provides a representative sample of the generated data showing the diversity of the indoor scenes, in terms of scene category, appearance, intra-class variation, density of objects and amount of clutter. This also shows the varying degree of difficulty of the data, which consists of both easy and hard examples.
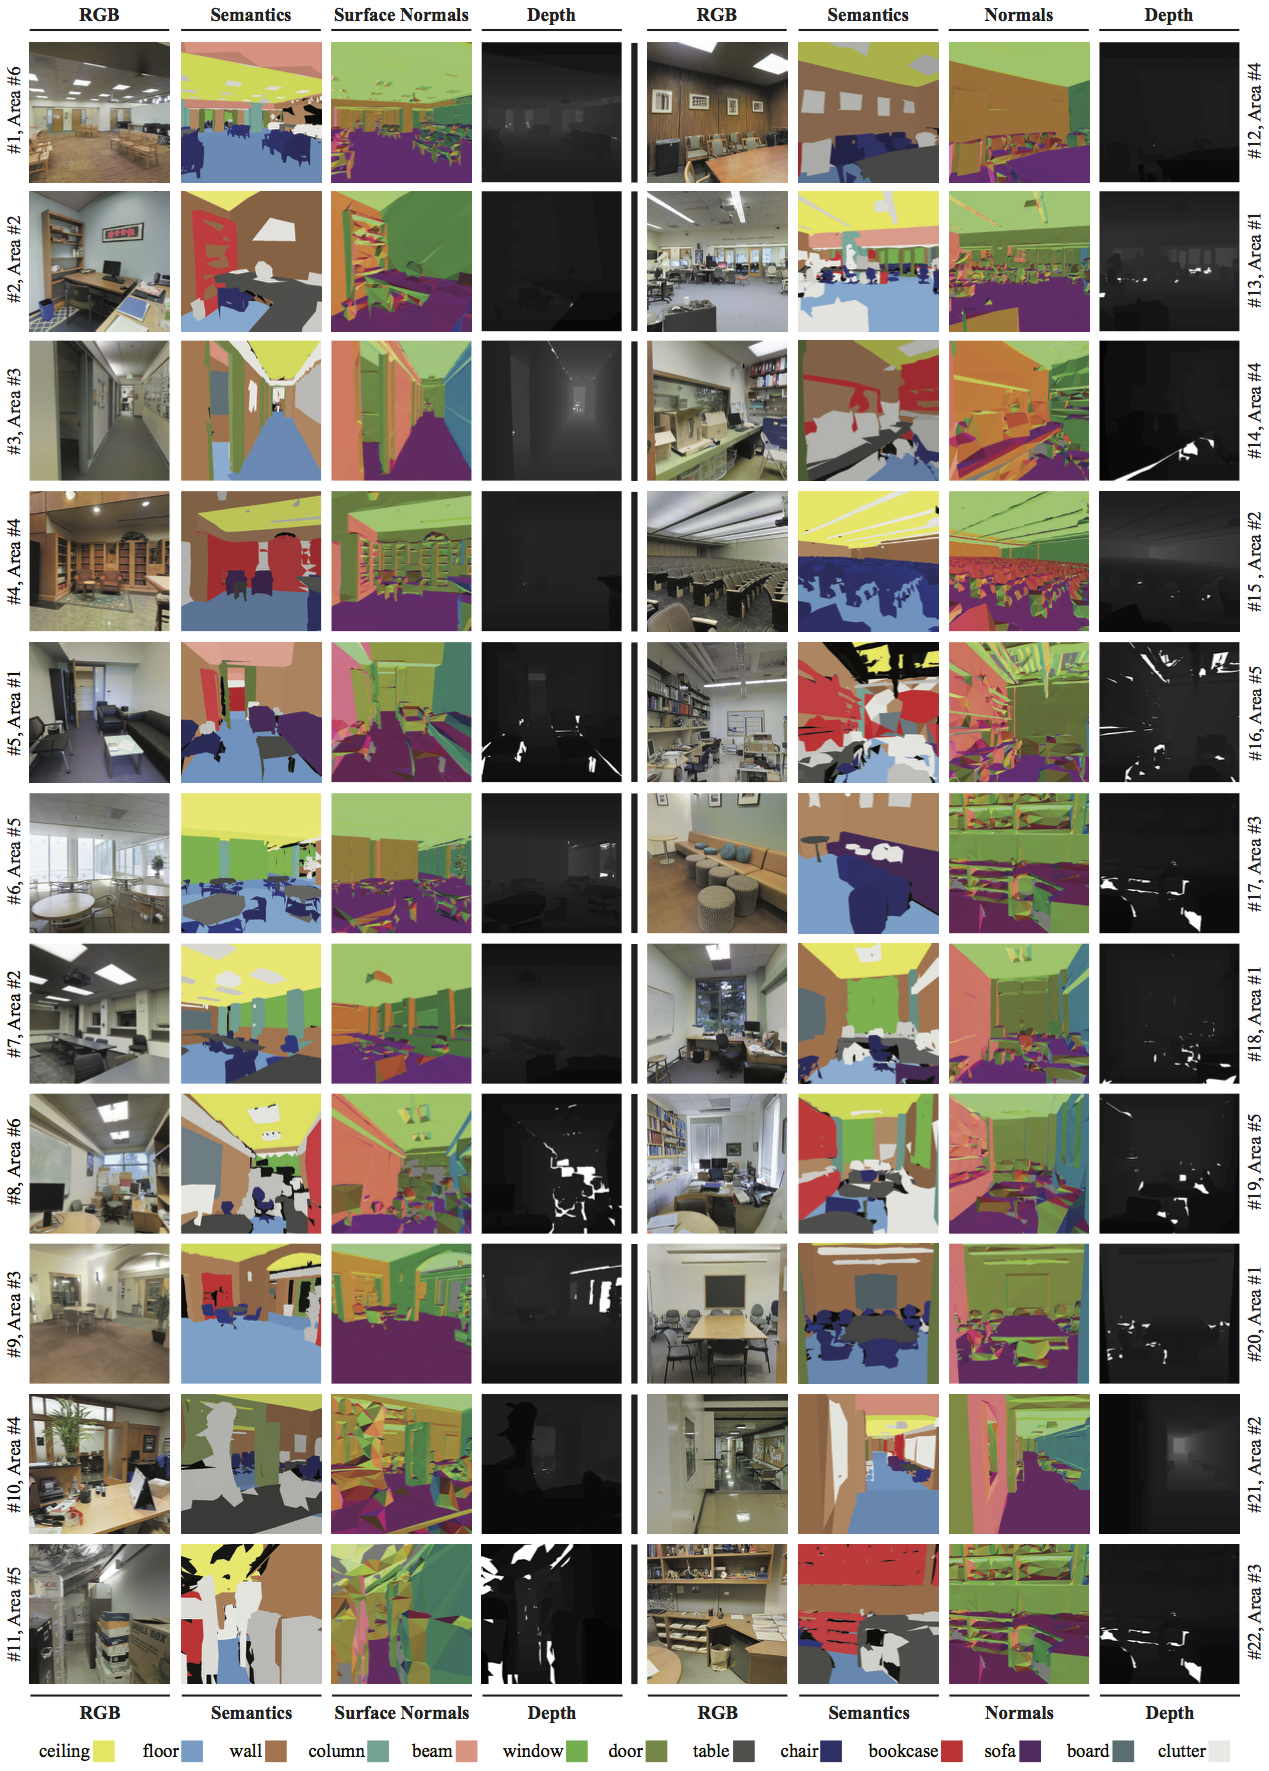
Fig 5. Examples Images of 2D and 2.5D Modalities. RGB, Semantic, Surface Normals and Depth images.
> Train and Test splits
Certain areas in the dataset represent parts of buildings with similarities in their appearance and architectural features, thus we define standard training and testing splits so that no areas from similarly looking buildings appear in both. We split the 6 areas in the dataset as per the Table below and follow a 3-fold cross-validation scheme.
| Fold # | Training | Testing |
| (Area #) | (Area #) | |
| 1 | 1, 2, 3, 4, 6 | 5 |
| 2 | 1, 3, 5, 6 | 2, 4 |
| 3 | 2, 4, 5 | 1, 3, 6 |
Table 1. Training and Testing Splits (3-fold cross-validation)
> Paper
Joint 2D-3D-Semantic Data for Indoor Scene Understanding
Iro Armeni*, Alexander Sax*, Amir R. Zamir, Silvio Savarese
Dataset Statistics
The annotations are instance-level, and consistent across all modalities and correspond to 13 object classes (structural elements: ceiling, floor, wall, beam, column, window, door, and movable elements: table, chair, sofa, bookcase, board and clutter for all other elements) and 11 scene categories (office, conference room, hallway, auditorium, open space, lobby, lounge, pantry, copy room, storage and WC). You can view more statistics at the Table below.
To see the 3D parsing results on the 3D point clouds of this dataset, see the results page.
| # of Images | per 2/2.5D | modality | ||
| Area | Image Type R | Image Type I | Image Type E | Total |
| 1 | 3,420 | 10,327 | 190 | 42,068 |
| 2 | 5,382 | 15,714 | 299 | 64,052 |
| 3 | 1,530 | 3,704 | 85 | 15,156 |
| 4 | 4,644 | 13,268 | 258 | 54,104 |
| 5 | 6,714 | 17,593 | 373 | 71,864 |
| 6 | 3,744 | 9,890 | 208 | 40,392 |
| Total | 25,434 | 70,496 | 1,413 | 287,636 |
Table 2. Statistics of Images.
(R: Raw Images, I: Regular Images,
E: Equirectangular Images)
| Area (m2) | Volume (m3) | Office | Conf. Room | Auditorium | Lobby | Lounge | Hallway | Copy Room | Pantry | Open Space | Storage | WC | Total Num | |
| Area 1 | 965 | 2850 | 31 | 2 | - | - | - | 8 | 1 | 1 | - | - | 1 | 45 |
| Area 2 | 1100 | 3065 | 14 | 1 | 2 | - | - | 12 | - | - | - | 9 | 2 | 39 |
| Area 3 | 450 | 1215 | 10 | 1 | - | - | 2 | 6 | - | - | - | 2 | 2 | 24 |
| Area 4 | 870 | 2780 | 22 | 3 | - | 2 | - | 14 | - | - | - | 4 | 2 | 49 |
| Area 5 | 1700 | 5370 | 42 | 3 | - | 1 | - | 15 | - | 1 | - | 4 | 2 | 55 |
| Area 6 | 935 | 2670 | 37 | 1 | - | - | 1 | 6 | 1 | 1 | 1 | - | - | 53 |
| Total Num | 6020 | 17,360 | 156 | 11 | 2 | 3 | 3 | 61 | 2 | 3 | 1 | 19 | 9 | 270 |
Table 3. Disjoint Spaces Statistics per Building Area.
| ceiling | floor | wall | beam | column | door | window | table | chair | sofa | bookcase | board | |
| Area 1 | 56 | 45 | 235 | 62 | 58 | 87 | 30 | 70 | 156 | 7 | 91 | 28 |
| Area 2 | 82 | 51 | 284 | 62 | 58 | 94 | 9 | 47 | 546 | 7 | 49 | 18 |
| Area 3 | 38 | 24 | 160 | 14 | 13 | 38 | 9 | 31 | 68 | 10 | 42 | 13 |
| Area 4 | 74 | 51 | 281 | 4 | 39 | 108 | 41 | 80 | 160 | 15 | 99 | 11 |
| Area 5 | 77 | 69 | 344 | 4 | 75 | 128 | 53 | 155 | 259 | 12 | 218 | 43 |
| Area 6 | 64 | 50 | 248 | 69 | 55 | 94 | 32 | 78 | 180 | 10 | 91 | 30 |
| Total Num | 391 | 290 | 1,552 | 165 | 260 | 549 | 174 | 461 | 1,369 | 61 | 590 | 143 |
Table 4. Object Class Statistics.