3D Semantic Parsing of Large-Scale Indoor Spaces
> Introduction
3D sensing has experienced a major progress with the availability of mature technology for scanning large-scale spaces that can reliably form 3D point clouds of thousands of square meters. Existing approaches for understanding semantics are not suitable for such scale and type of data. This requires semantic parsing methods capable of coping with this scale, and ideally, exploiting the unique characteristics of such point clouds (e.g. complexity, richer geometric information, etc.).
We propose a method for parsing the point cloud of an entire building using a hierarchical approach (see Fig 1): the first step parses the point cloud into semantically meaningful spaces (e.g., rooms, hallways, lobby) and aligns them in 3D. The second step parses each of these spaces into their structural and building elements (e.g., walls, columns, etc). Below is a short description of our method. For details check out our paper and supplementary material.
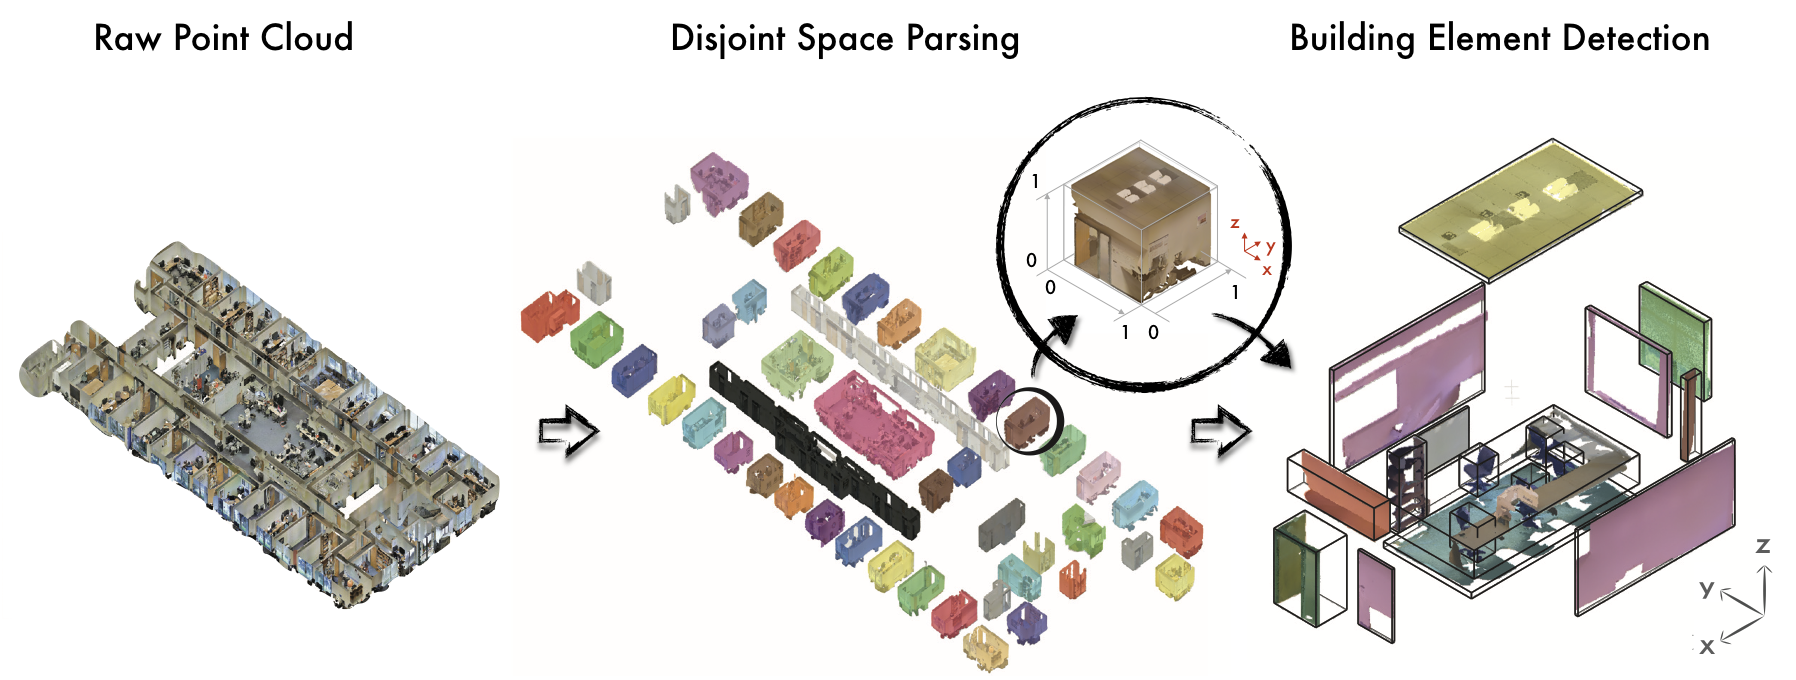
Fig 1. Semantic parsing of a large scale point cloud. Left: the raw point cloud. Middle: the results of parsing the point cloud into disjoint spaces (i.e. the floor plan). Right: the results of parsing a detected room (marked with black circle) into semantic elements.
> Publication
paper, supplementary material, bibtex, poster
This technology is patent-pending. Feel free to contact us for more information.
Featured in:
- June 29, 2016. Stanford News: Stanford researchers automate process for acquiring detailed building information
- June 29, 2016. myScience: Researchers automate process for acquiring detailed building information
- July 5, 2016. Semiconductor Engineering: Automated data collection
- July 6, 2016. American Society for Quality (ASQ): Computer Vision System to Automate Acquiring of Detailed Building Information
- July 20, 2016. ENGINEERING.COM New Method for 3D Scanning Buildings Uses Machine Learning
- July 20, 2016. SPAR 3D: Stanford Innovation Makes Point Clouds Smart
> Input Data
The input to our method is a raw colored point cloud of a large-scale indoor space (e.g. multiple floors, whole/part of a floor, etc.). To this end we collected a new dataset of several buildings with a covered area of over 6,000m2 and over 215 million points. For some examples of the kind of spaces we used for training and testing you can check this video:
> Parsing into Disjoint Spaces
We begin by parsing the point cloud into enclosed spaces (i.e. spaces which boundaries are partially or completely defined by building elements). Common approaches to finding spatial layout identify wall surfaces with surface or line fitting algorithms such as RANSAC or Hough Transform. However these approaches require fine-tuning parameters and are susceptible to clutter, noise and outliers. We exploit the representation of walls in point clouds and recurrent geometric patterns and seek to identify space dividers. Motivated by the peak-gap-peak signature of walls in 1D histograms of density of points projected to the major axes of a scanned area, we form a bank of filters designed to fire in the location of walls when convolved with such signals. We convolve each axis's histogram of density of points with our filter bank which results to candidate space dividers. The pipeline of how we identify space dividers is shown in Fig 2.
Fig 2. Space divider detection algorithm per main axis. Histogram signal along an axis x is the histogram of x coordinates of all points. We start with the histogram signal, convolve it with the filter bank and perform a max-pooling operation. We find the final space dividers by applying Non Maximum Suppression.
We use the location of the space dividers to slice the point cloud along the first axis and we repeat the same procedure iteratively for each of the remaining main axes to completely segment the point cloud. We chose to perform the segmentation across each of the main axes one by one, rather than all of them together, in order to keep the complexity linear with respect to the covered area. However, this leads to an over segmentation, which we can efficiently merge using the following process: we recursively merge segments that belong to the same enclosed space by identifying the existence of a space divider in the connection area of two neighboring segments. This step is illustrated in Fig 3.
Fig 3. Merging the over-segments: We segment each main axis independently and end up with a set of over-segments (c) generated from the point cloud (a) and create the neighbor graph of over-segments (d). Then, we merge nodes (e-f).
Below you can see our results for different building areas. For quantitative results and other baselines take a look at our paper.
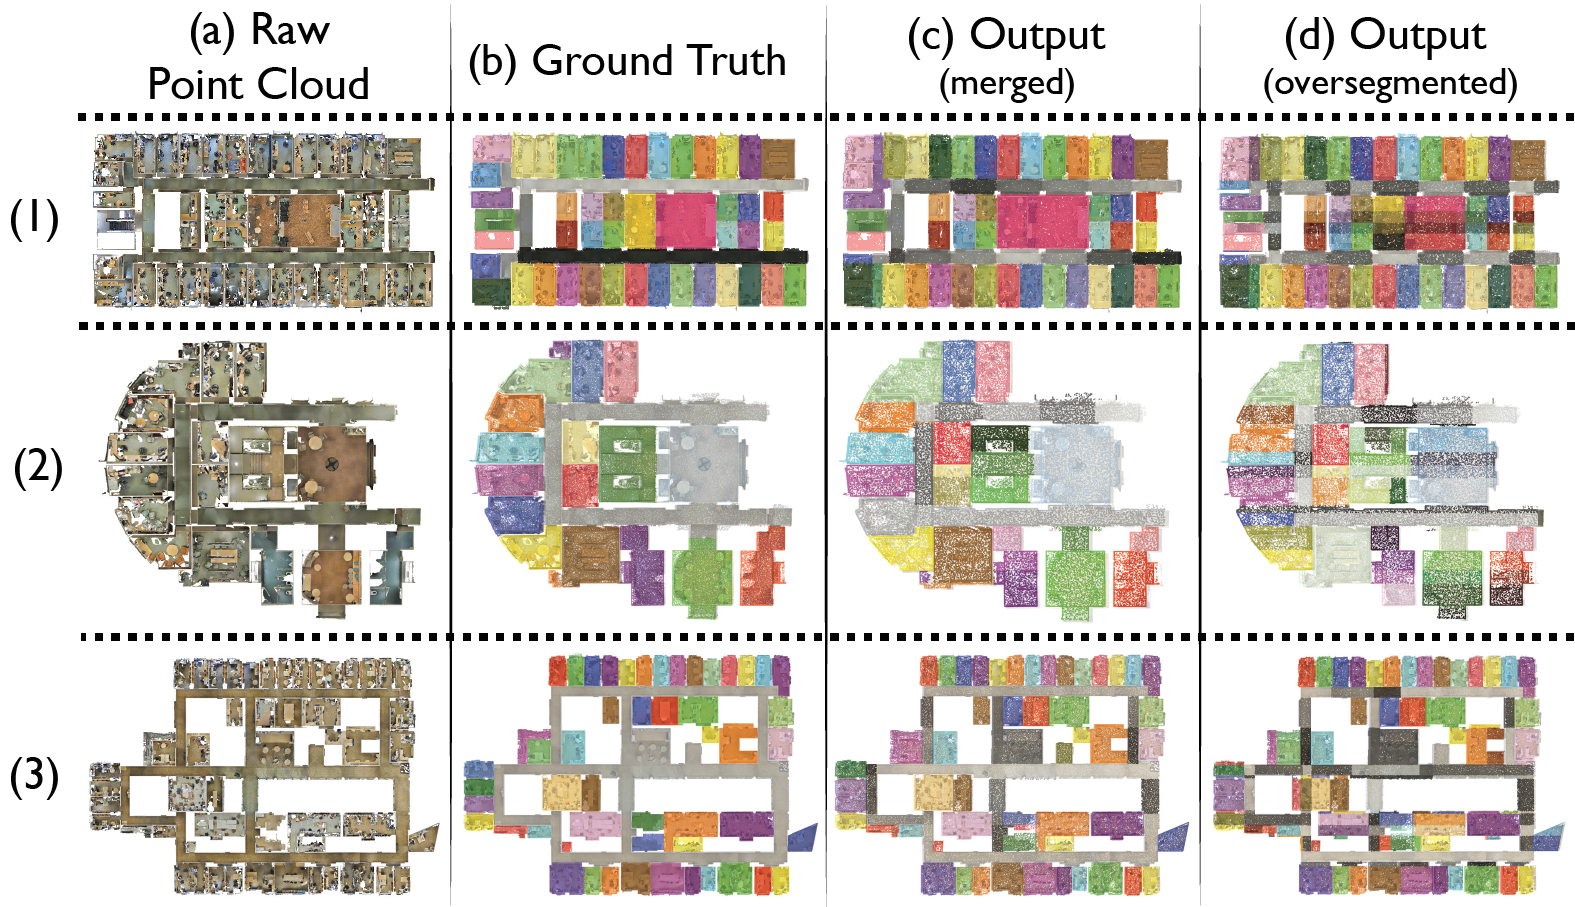
Fig 4.Space Parsing Qualitative Results.
| Building | final | over-segm |
| (1) | 0.94 | 0.59 |
| (2) | 0.82 | 0.76 |
| (3) | 0.69 | 0.44 |
| (4) | 0.66 | 0.42 |
| mean | 0.77 | 0.55 |
Table 1. Average precision of space parsing. (mapping to the dataset areas: (1)--> Area 1, (2)--> Area 6, (3)--> Area 3, (4)--> Area 5)
> Acquiring a common geometric space
Parsing the large-scale point cloud into disjoint semantic spaces provides a strong geometric prior for parsing semantic elements. This is mostly because spaces within the same building have a recurrent structure and layout configuration. This structure can easily be exploited by creating a common geometric space for all rooms. Specifically, we align and scale into the unit cube (normalization) all spaces to associate a local reference system for each semantic space (e.g. rooms, hallways etc.).
> Parsing Spaces into Semantic Elements
We continue by detecting structural and non-srtuctural elements in each of the disjoint spaces following the typical sliding window approach. We follow a detection and not segmentation strategy in our second step because many applications that emerge from this semantic understanding would benefit from a notion of the parsed elements as a whole and their structural characteristics rather than the fragmented understanding segmentation offers.
We take advantage of the strong priors that the common geometric space provides and extract both local and global features (see Fig 4). During training we compute these features for all instances per class and train one vs. all SVM classifiers, one for each class. We use Affinity Propagation Clustering with metrics IoU and binary occupancy to group each class's instances and acquire a Dictionary of Shapes by averaging across the group members.

Fig 5. Detection box, and the features for a sample object (table). Our features are the detection anchor point, size and features of each sub-box. Features of the non-occupied voxels are 0.
During testing we slide all shapes in the Dictionary and evaluate all SVM's per sliding position. We further eliminate the detections with non-maximum suppression. To account for contextual information we use a graphical model based approach so that we parse space in a way that all resulting elements are consistent with each other. Below you can see our results for 12 classes (ceiling, floor, wall, beam, column, door, window, table, chair, bookcase, sofa, board). You can also navigate in our results in 3D in the results page.
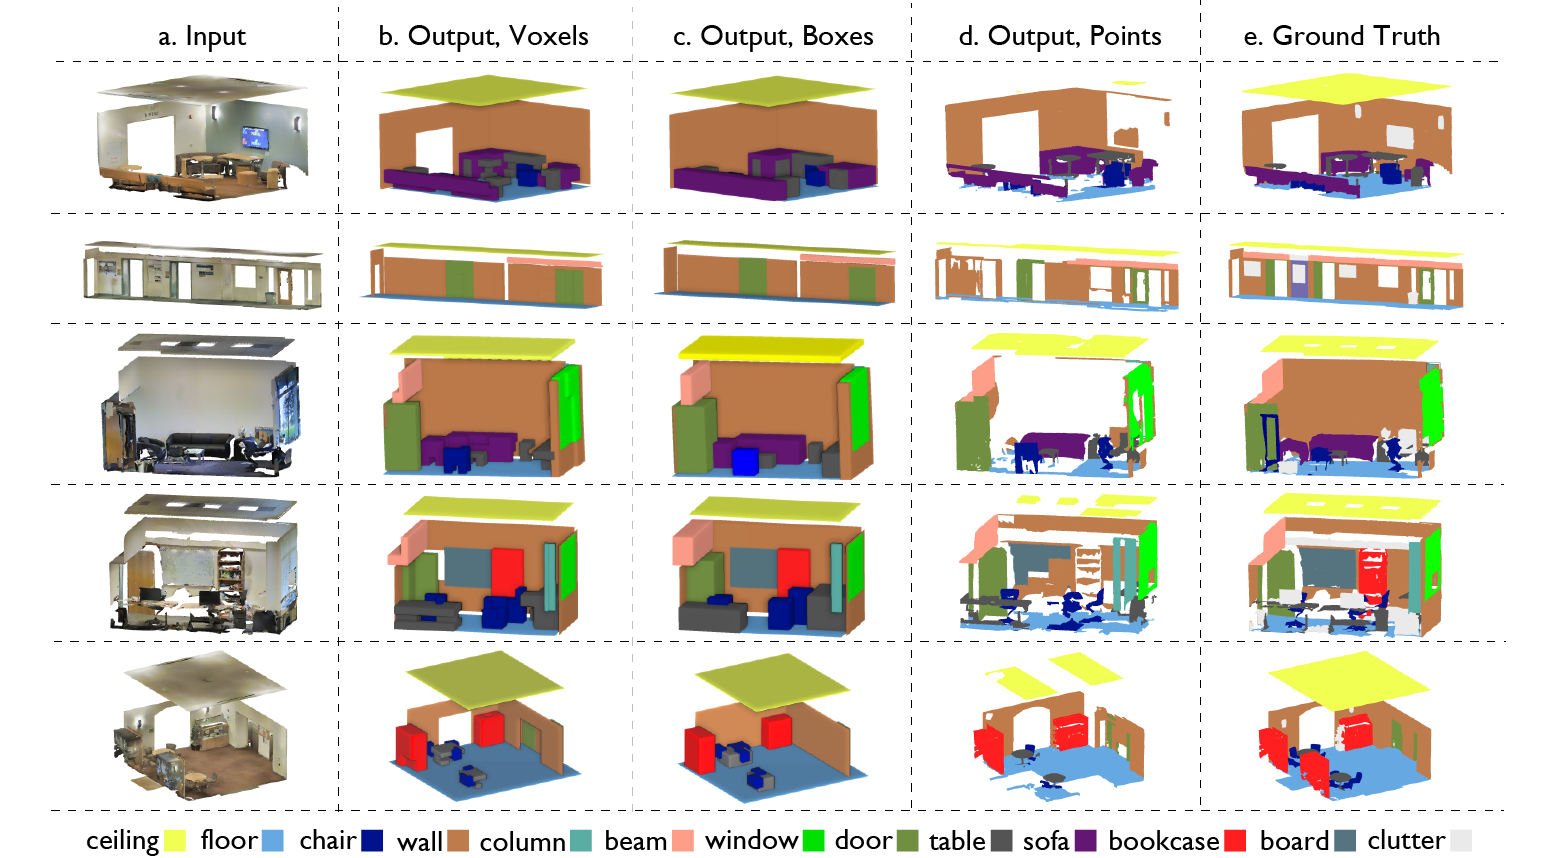
Fig 6.Qualitative results of parsing spaces into their semantic elements. Notice the heavy contribution of the global geometry features.
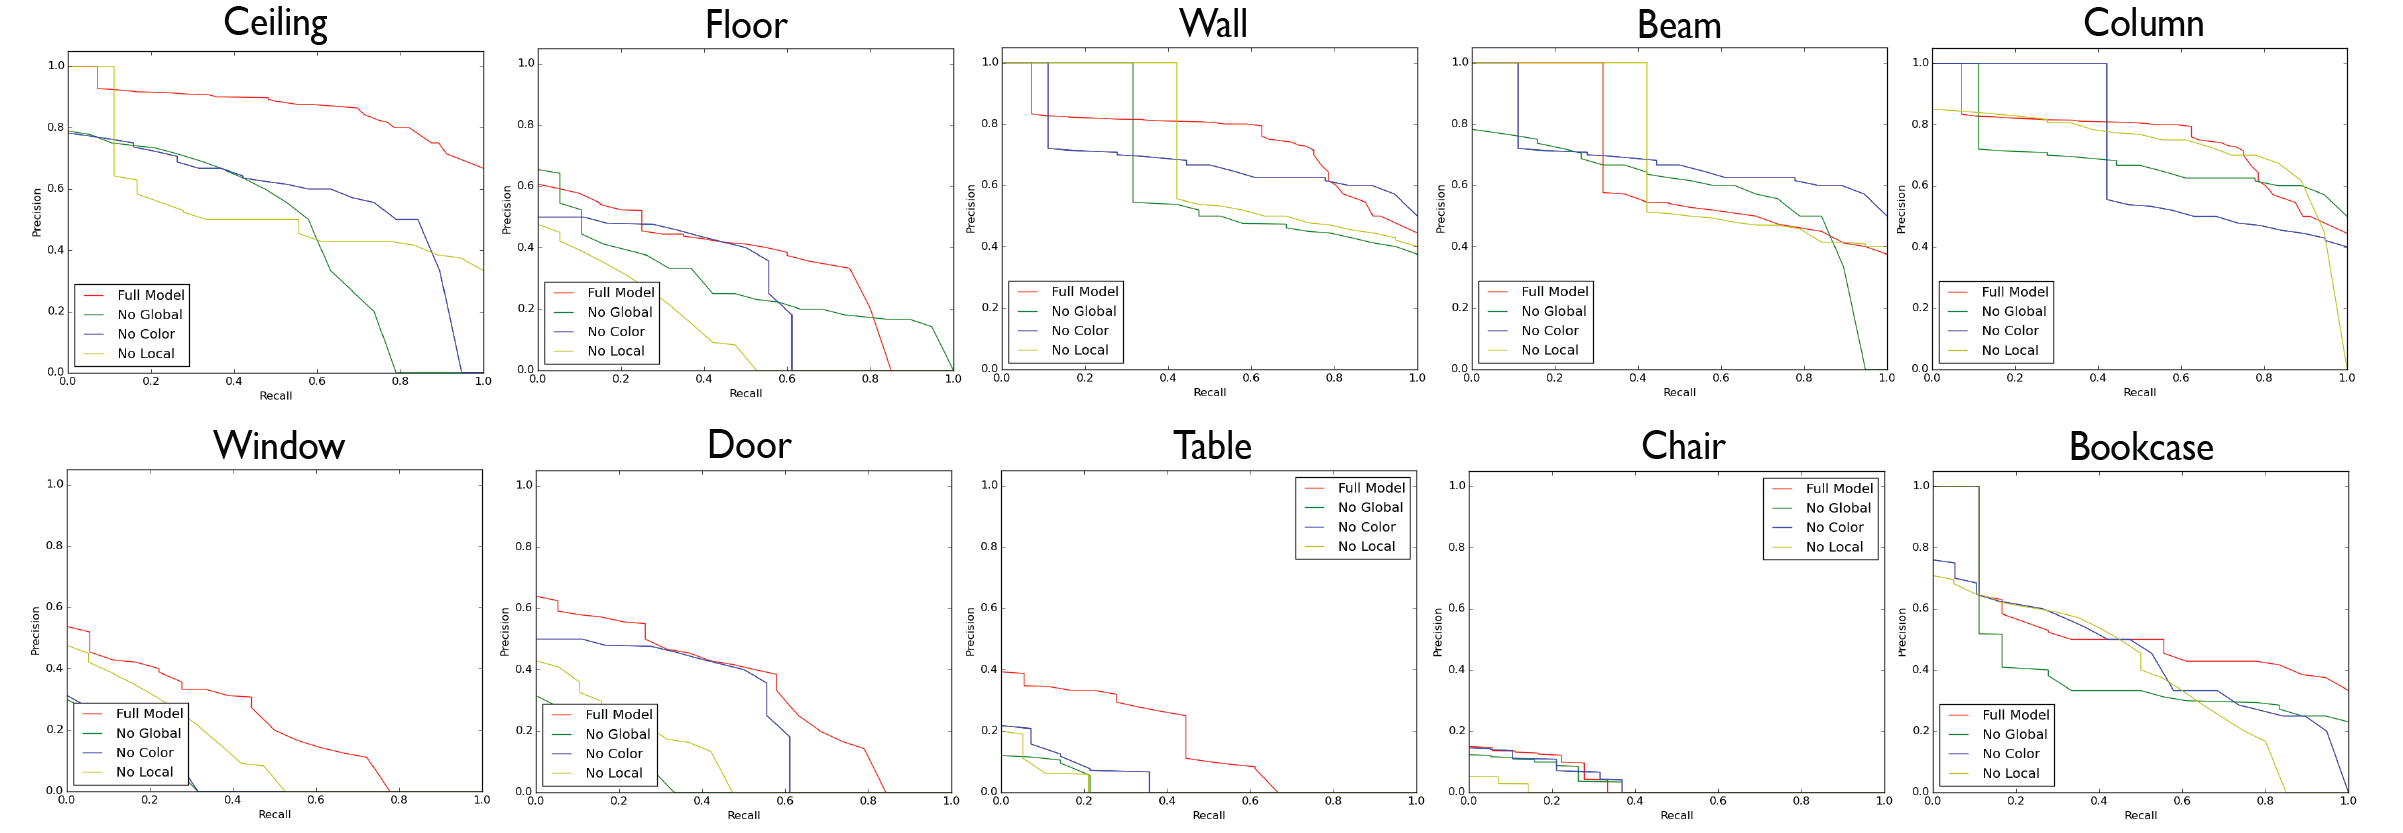
Fig 7. Class specific PR curves for each semantic class.
| Structural Elements | Furniture | overall | |||||||||||||
| ceiling | floor | wall | beam | column | window | door | mean | table | chair | sofa | bookcase | board | mean | mean | |
| Ours (full) | 71.61 | 88.70 | 72.86 | 66.67 | 91.77 | 25.92 | 54.11 | 67.38 | 46.02 | 16.15 | 6.78 | 54.71 | 3.91 | 25.51 | 49.93 |
| Ours (no global) | 48.93 | 83.76 | 65.25 | 62.86 | 83.15 | 22.55 | 41.08 | 57.27 | 37.57 | 11.80 | 4.57 | 45.49 | 3.06 | 20.35 | 41.87 |
| Ours (no local) | 50.74 | 80.48 | 65.59 | 68.53 | 85.08 | 21.17 | 45.39 | 58.73 | 39.87 | 11.43 | 4.91 | 57.76 | 3.73 | 23.78 | 44.19 |
| Ours (no color) | 48.05 | 80.95 | 67.78 | 68.02 | 87.41 | 25.32 | 44.31 | 59.73 | 50.56 | 11.83 | 6.32 | 52.33 | 4.76 | 25.30 | 45.41 |
Table 2. Class specific average precision of our method when using different features.
> Comparison with Conventional RGB-D
We compare our method against semantic RGB-D segmentation baselines mainly to evaluate the performance of our 3D parsing method against such techniques (results in Table 3 and Fig. 8). We also aim to answer the question whether it is better to carry out semantic parsing on RGB-D images or to perform it in 3D on the point cloud and transfer the results onto image domain. To this end, we enriched our dataset with 300 RGB-D images registered on the point cloud in a semi-automatic way and used the image-point cloud correspondences to transfer the 3D semantic annotations. For more details see Section 5.4 in the paper.
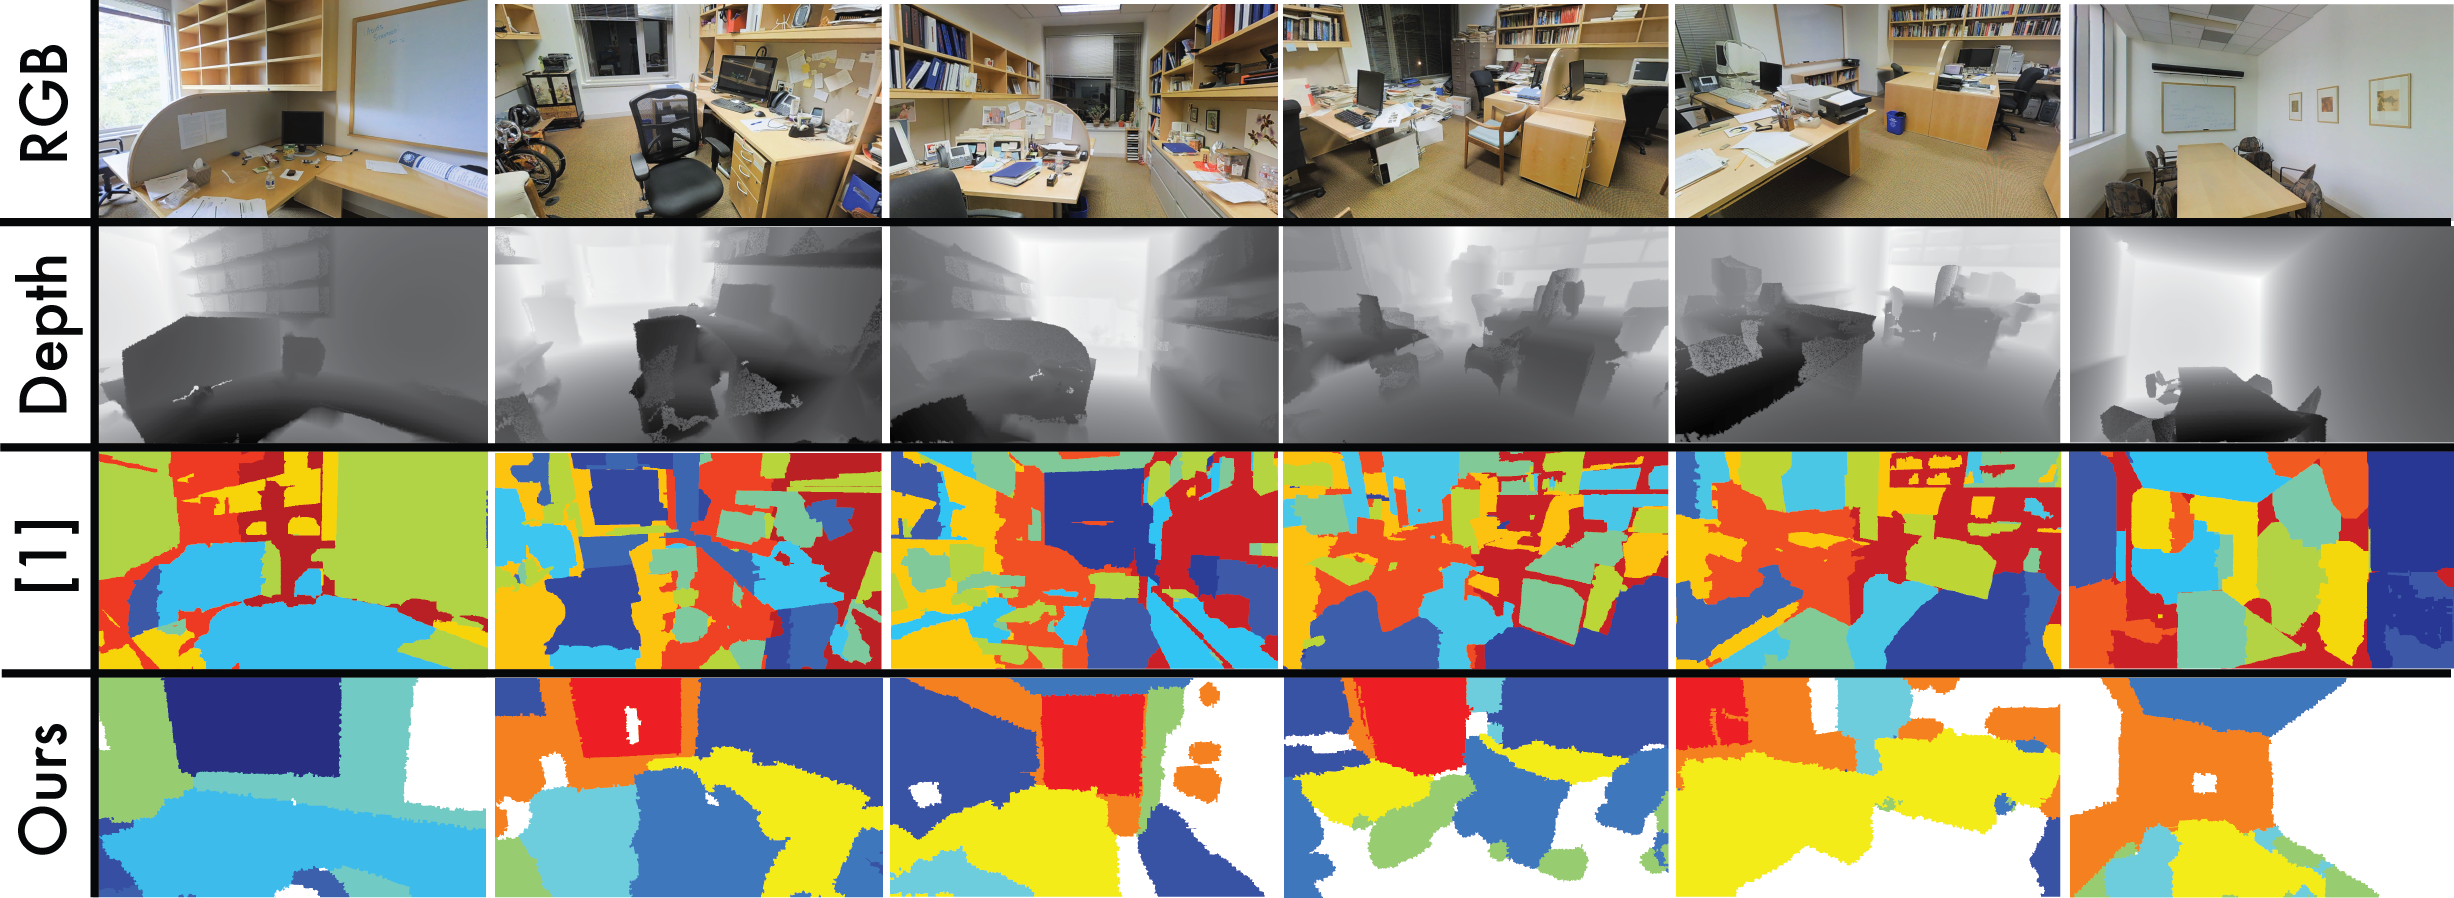
Fig 9. First column is the RGB image, second column is the depth image, 3rd column is the segmentation results of [1] and the last column is our projected results. It should be noted that [1] and our method are using different set of classes; hence, we show the segmentation results for visualization purposes only.
| method | RGB-D [1] | Ours |
| mIOU | 20.9 | 38.5 |
Table 3. Evaluation as RGB-D segmentation: Mean intersectionover-union of our method and [1]. [1] L. Bo, K. Lai, X. Ren, and D. Fox. Object recognition with hierarchical kernel descriptors. In Computer Vision and Pattern Recognition (CVPR), 2011 IEEE Conference on, pages 1729–1736. IEEE, 2011
> Applications of Semantic Parsing
We illustrate some simple applications that naturally emerge from a semantically parsed point cloud, such as automatic extraction of space statistics, automatic coarse calculation of relative natural light score and automatic space manipulation.
Space Statistics
Knowing space statistics of an existing space is the start- ing point for refurbishment, energy performance analysis, interior design, etc. We use the found voxelized detection boxes and compute their intersection with the point cloud, to find those points that belong to each semantic element. We then compute a variety of space statistics, such as volume, area, size and width of the semantic elements, per floorplan or disjoint space (see Fig 8).
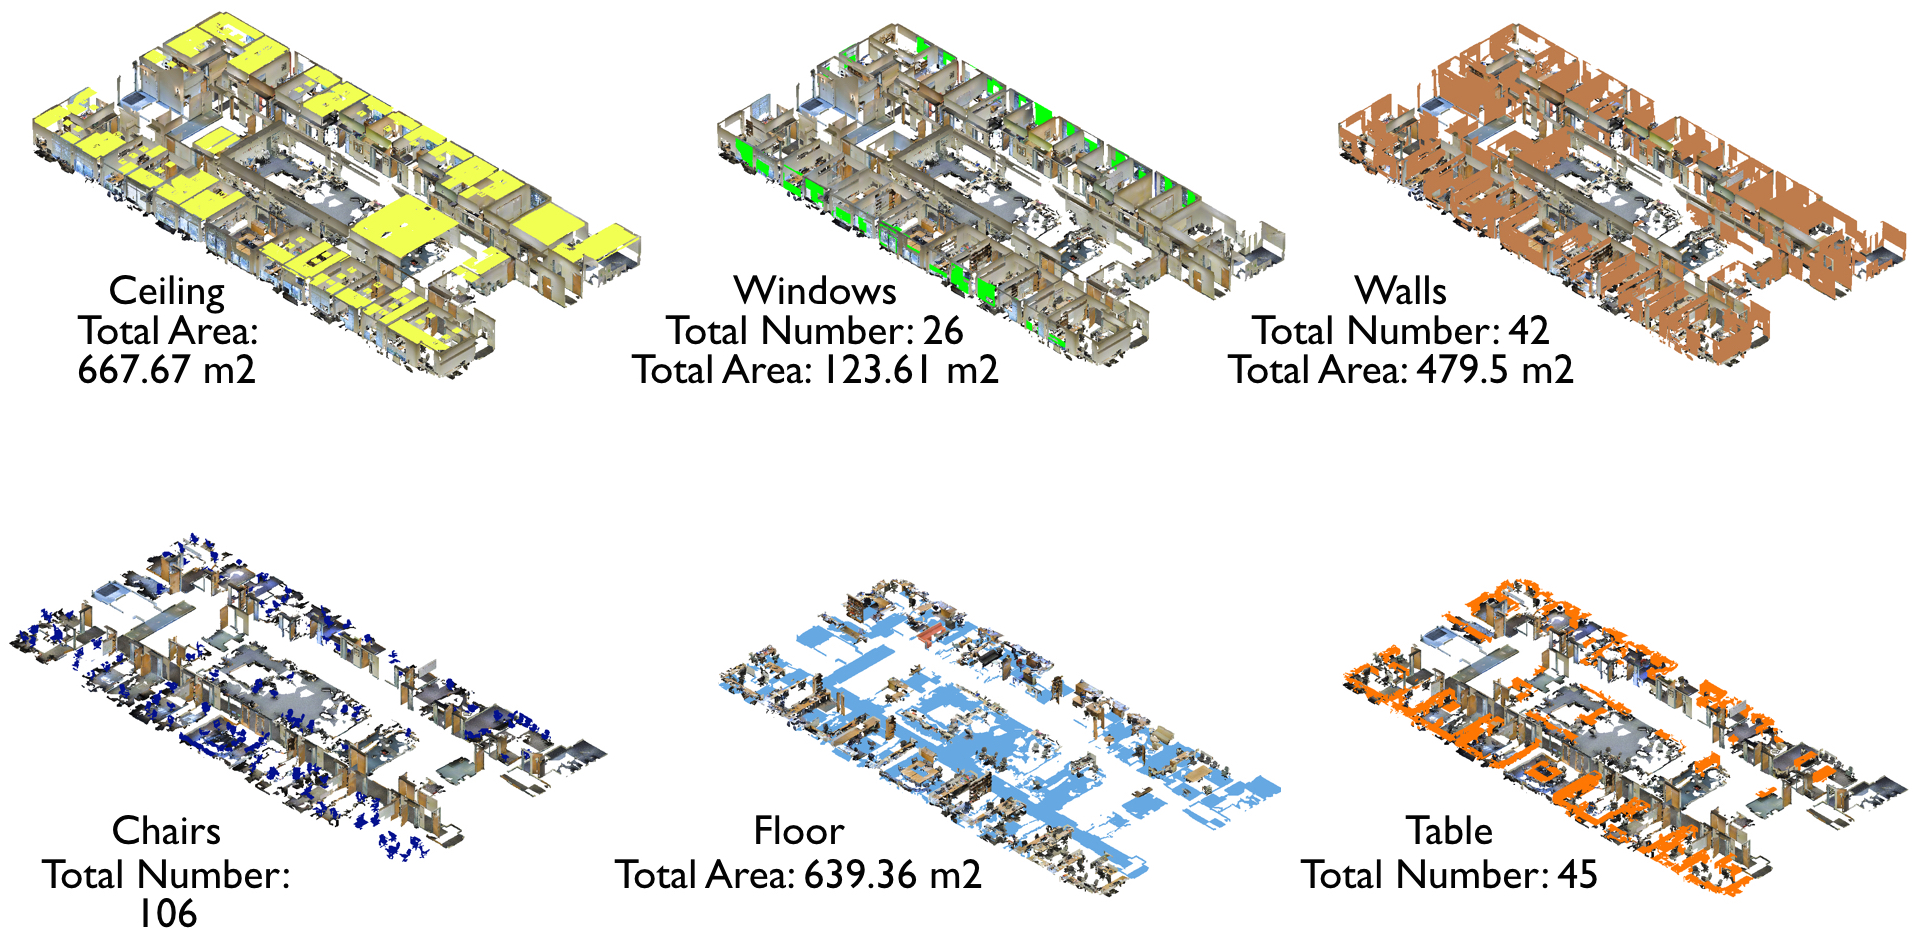
Fig 9. Qualitative results of parsing spaces into their semantic elements. Notice the heavy contribution of our global geometry features.
Estimation of Natural Illumination Model
Another example is the approximate calculation of the relative gradient of natural light per space based on the proximity to a window (Fig. 9). We compute the distance of each point from the closest window, taking into account occlusions due to walls, doors and other building elements.
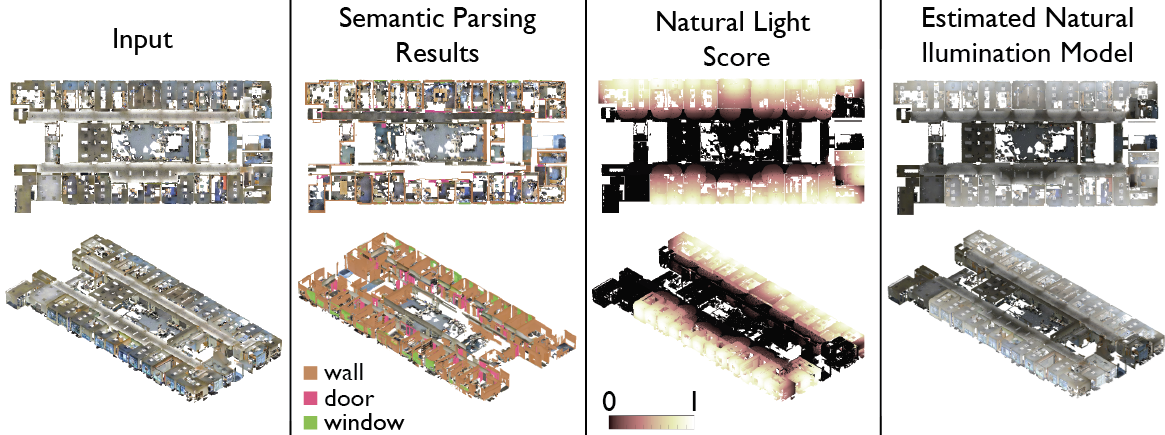
Fig 10. An application of large scale semantic parsing: automatically estimating the natural Illumination model of spaces based on the proximity to windows and placement of building elements for reflection reasoning.
Space Manipulation
By knowing the semantics, one can visualize how two spaces would look like if they were connected by removing the walls (Fig. 11 b), or further how they would be perceived if they were empty, by removing the furniture (Fig. 11 c,d). This find numerous applications in interior design, graphics, etc.
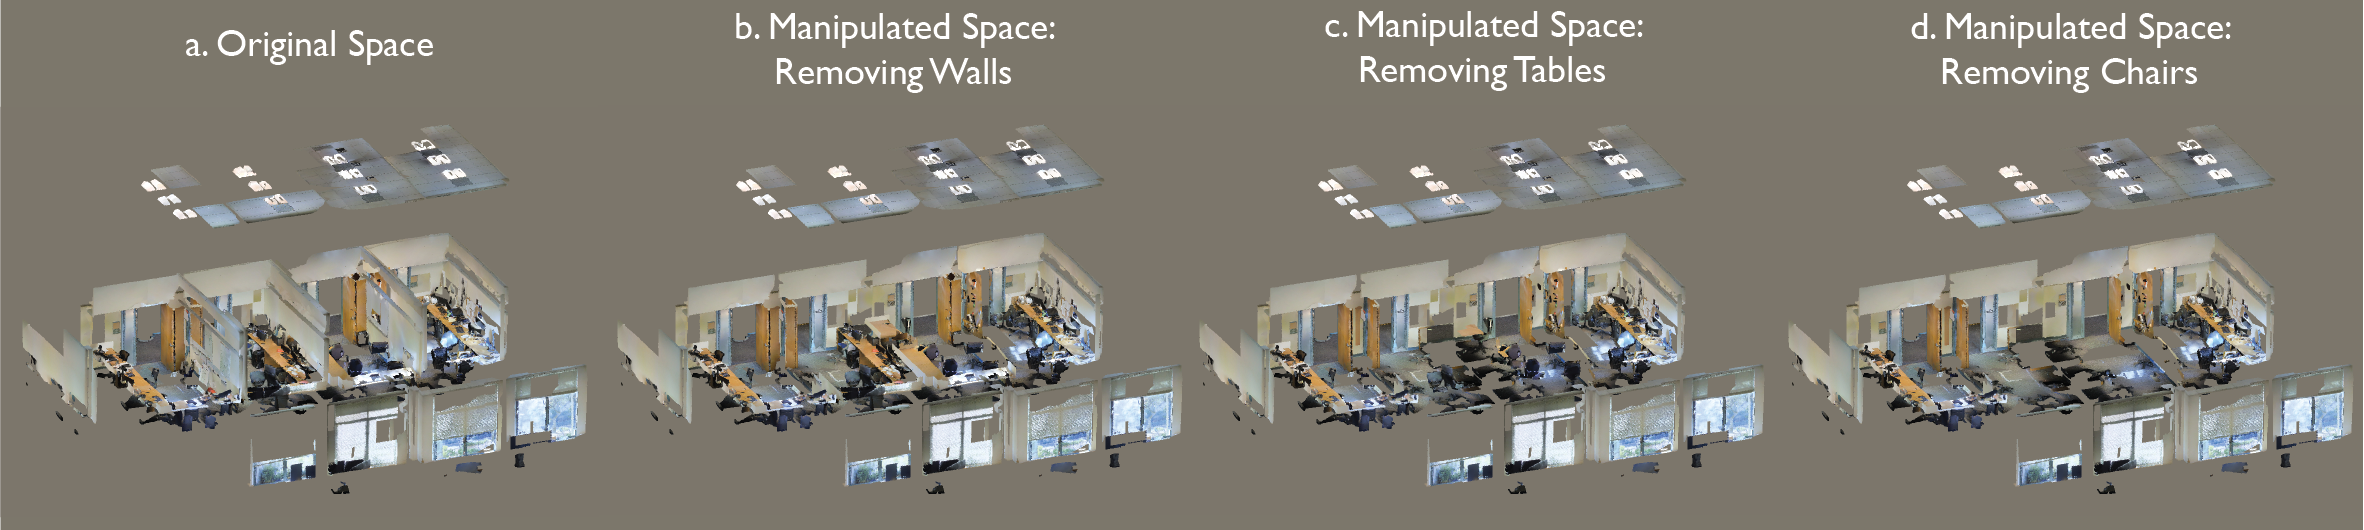
Fig 11. Space Manipulation
CVPR 2016 Oral Presentation
Why are we doing this?
We are very passionate about understanding 3D space. We have a building-centric view and we aim to study 3D space to increase our knowledge on buildings in terms of layout, elements, function and use. This project is one small part of our vision.
We built this website to publicly share the collected dataset and our results, but foremost to improve our method. By allowing users to upload their own data we will be able to test it in a variety of scenarios and increase our training set, which will help us to address any shortcomings.
Who are we?
This research is conducted at the Computer Science and Civil and Environmental Engineering Departments, Stanford University.
Team:


Other links: